Drive-Thru Pedagogy Blog
Pick up something practical.
Teaching Statistics with House Shopping
October 25, 2021 • Rachel Chung
Statistics is an extremely practical tool used in many business applications ranging from quality control in manufacturing, Netflix recommendations to Google ads. However, it is also an abstract topic that intimidates and frustrates many students. To help students learn and apply statistics more effectively, I asked them to go house shopping. Well, they just needed to pretend to buy a house. With an unlimited budget, each student was asked to pick a real estate property in the Williamsburg area listed on Zillow, and enter data about the property using a survey. Then, we spent the rest of the semester calculating numbers and analyzing the dataset in different ways. View the dataset and different analyses.
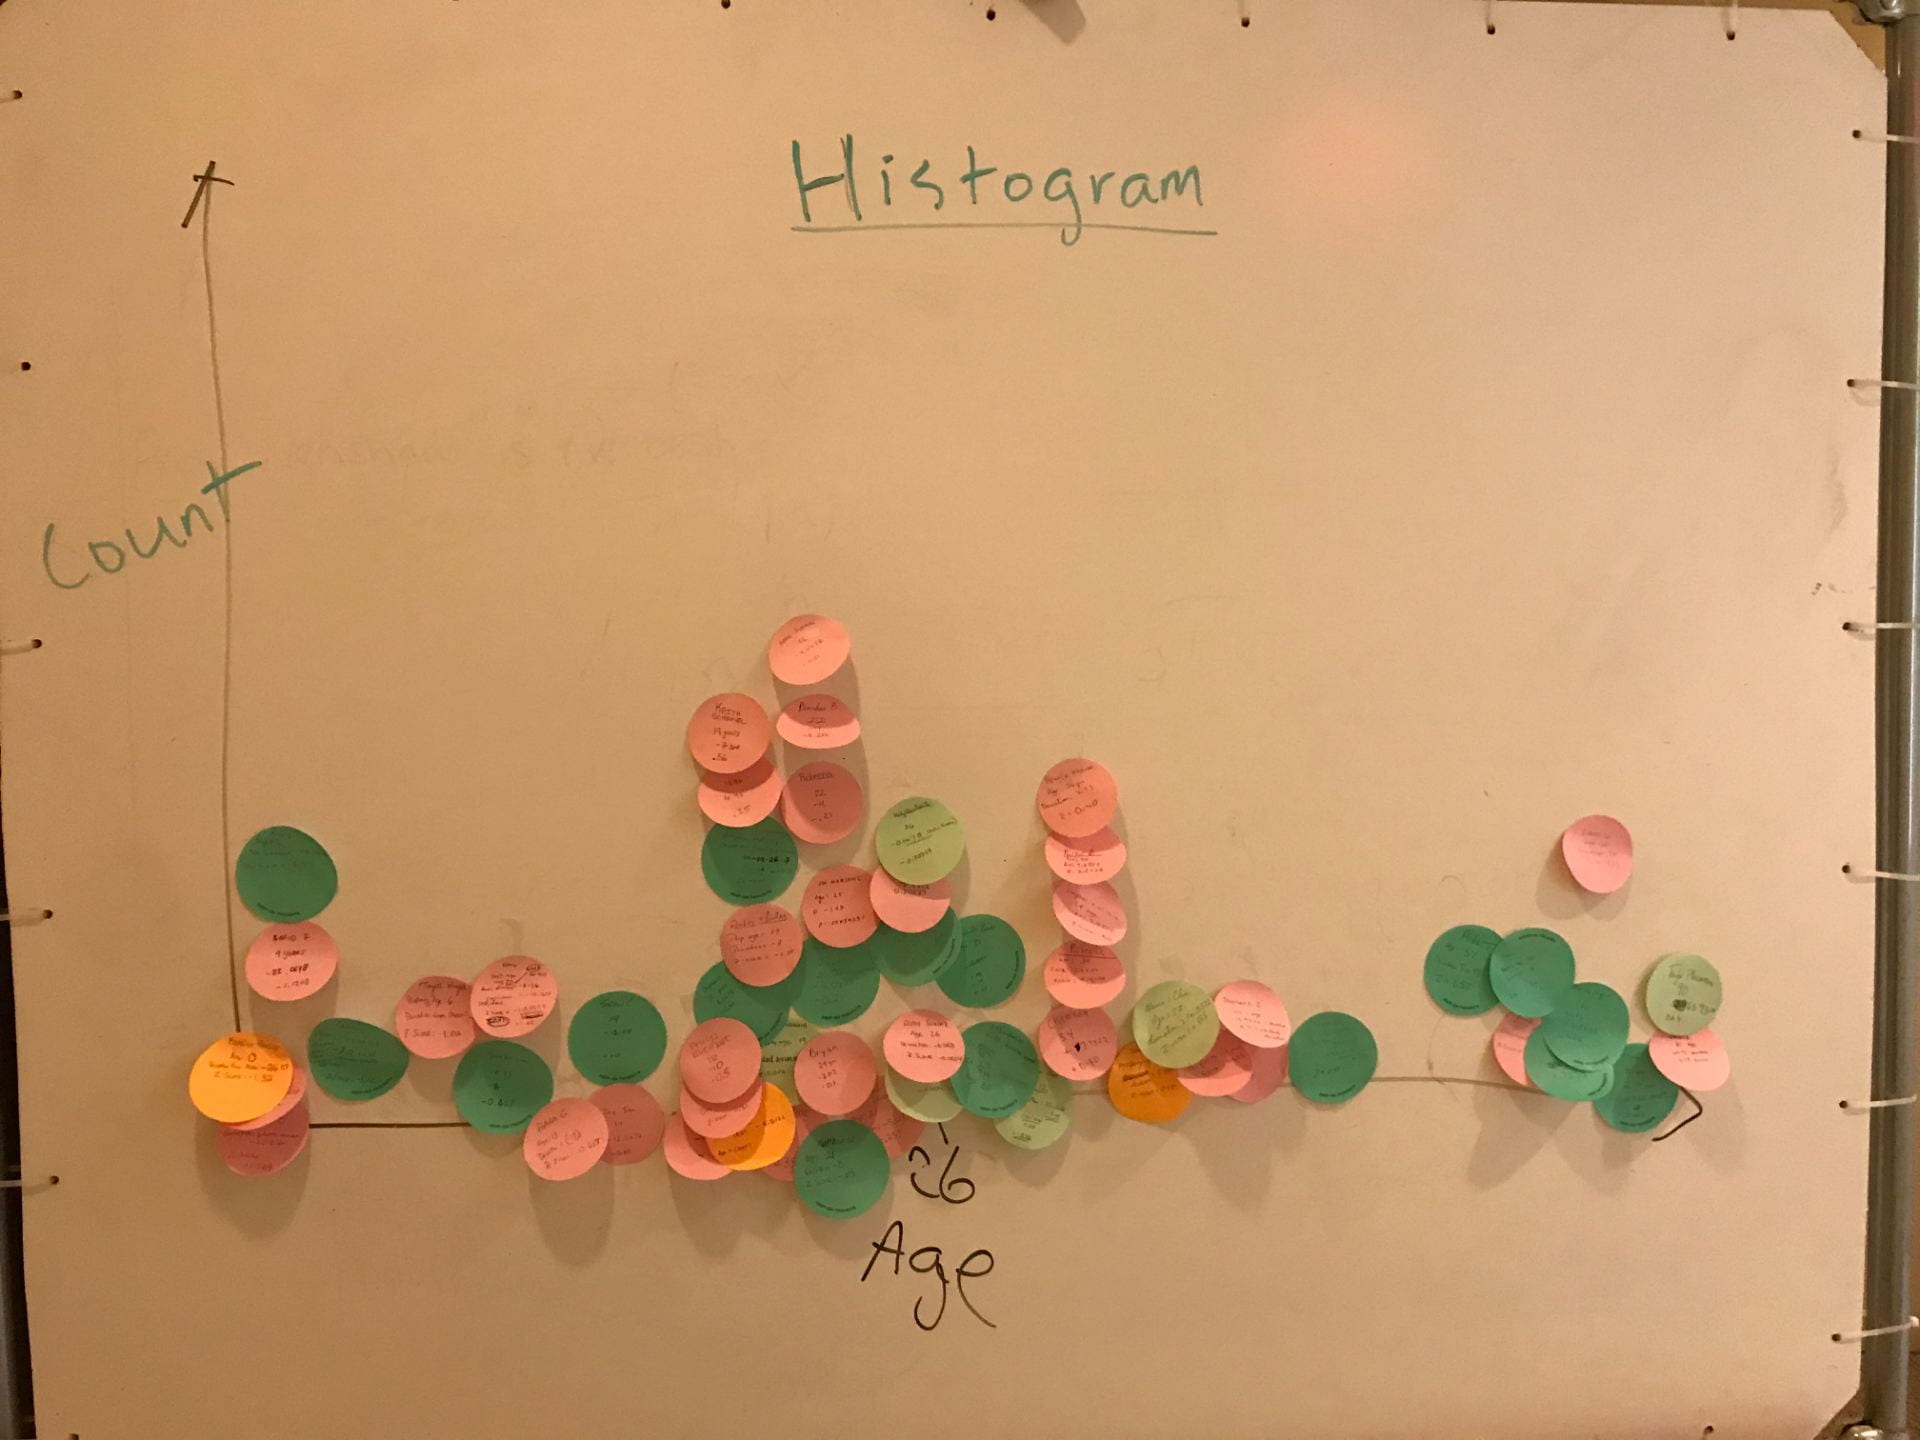
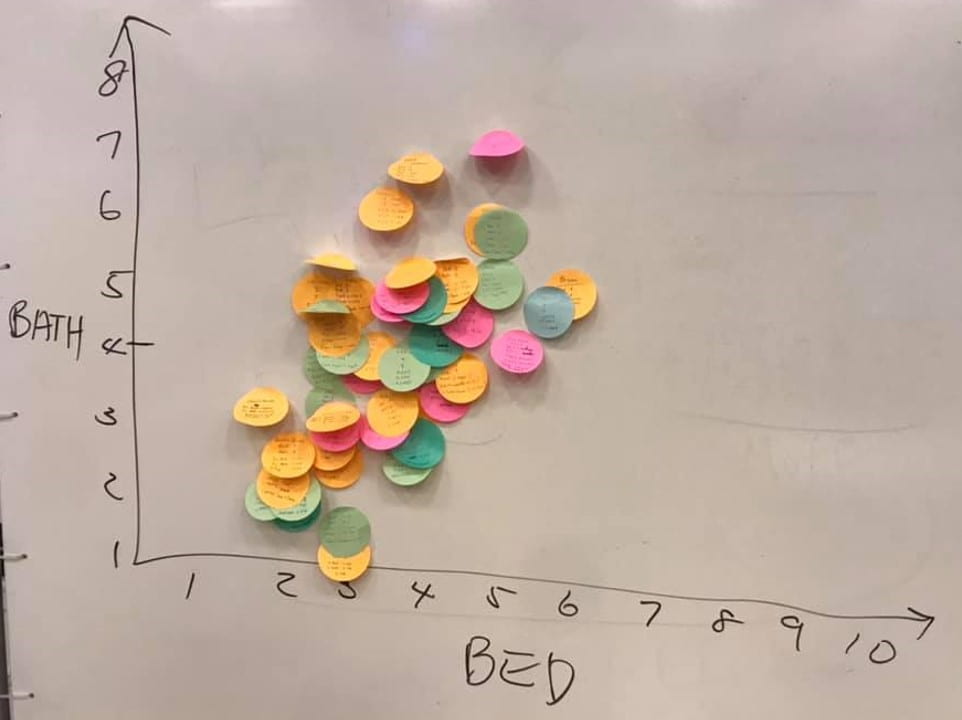
When we computed deviations or residuals, I asked students to compute these scores using their selected real estate properties. Then, I asked them to write down their scores on their own “data dots,” or round-shaped sticky notes. We then put them up on a whiteboard to construct a histogram or a scatterplot.


This exercise is useful in many ways. Students get to clearly distinguish measures that belong to an individual case, such as deviation, from measures that belong to an entire dataset, such as standard deviation. They also develop a deeper appreciation of the relationship between a case and a dataset.
Real estate datasets are a good choice for two key reasons. (1) The business domain knowledge is easily accessible to the general population. For example, most people intuitively understand that bigger houses (i.e., larger square footage) are probably more expensive, and adding a bathroom would probably increase the value of the property. Also, (2) the relationships amongst the variables are usually strong and predictable. For example, the number of bedrooms is always highly correlated with the number of bathrooms. Each additional bedroom always adds a significant chunk of value. Therefore, as an instructor, I don’t have to worry whether the statistical magic will work again in a new semester.
The survey includes both categorical variables (e.g., Zip Code) and numeric variables (e.g. Price). Price, like most financial data, is always skewed, which gives us the opportunity to discuss transformation. Therefore, we can use the same dataset to run a wide range of analyses by combining different categorical and numeric variables. In fact, we can get through an entire semester using the same dataset and never run out of ideas.
Zillow uses their dataset to produce Zestimate, a real-world application of machine learning predictions for estimating property valuation. Conceptually, Zestimate is intuitive for most people. When students realized that they can build their own Zestimate models after having learned regression analysis, they often got a great sense of accomplishment. We then visited the Zillow Research site together to study additional explanations of Zestimate, and again students felt a great sense of satisfaction when they realized that they could actually understand all the technical jargon that describes how Zestimate works!
As we finished up the semester, we built our own Zestimate equations, made our own predictions, and calculated our prediction accuracies. For example, the beta coefficient told you how much the price would increase if the house had an extra bedroom, or how much the price would drop if the house moved from Zip Code 23185 to 23188. These simple, vivid, and intuitive exercises made the rather abstract concepts easier to digest.
Statistics can be intimidating due to its obscure jargon. Real estate data analysis makes these abstract and technical concepts much more concrete and approachable. Having students participate in the process of putting together a real estate dataset not only makes the dataset more personable, but also serves as an excellent tool to introduce statistical concepts in a gentle, concrete, and enjoyable manner!
For more information about Dr. Chung’s Data Analysis course in the MBA program, please visit the course page. Visit Dr. Chung’s website to learn more.
© 2021 Rachel Chung. The text of this work is licensed under a Creative Commons BY-NC-ND 4.0 International License.
Meet the Author
Rachel (Tingting) Chung
Clinical Associate Professor in the Raymond A. Mason School of Business
