Drive-Thru Pedagogy Blog
Pick up something practical.
The Visual Syllabus: A Fresh Approach to Simplified Course Communication
June 23rd, 2023 • Dana Lashley
Last semester I came across the idea of a visual syllabus that a small handful of faculty had developed for their courses and were posting about it on Twitter.
It has not escaped me that Twitter is a controversial platform these days. However, it offers a great way for me to interact with professionals in academia in my own field and beyond. My network on Twitter allows me to find out in real-time about all the cool and effective new things that other faculty may be testing out in their classrooms. So, this is how I first heard about the visual syllabus.
I was immediately taken by the idea, as my own syllabi have grown so bulky that it is nearly impossible to quickly locate the most important information. A saying comes to mind that is quite fitting here: “The students can’t find the forest for the trees.” The traditional syllabus has become an insurmountable mammoth of a document. To quote the world’s first organic chemist, Friedrich Wöhler: the syllabus has become “a dreadful, endless jungle into which one dare not enter” (to be fair Wöhler was talking about organic chemistry, and not a syllabus).
My organic chemistry syllabus, for example, currently spans a glorious 10(!) pages. With the amount of work that flows into creating a traditional syllabus, some academics have even argued that developing a syllabus for a brand-new course should count as a publication. Although all of the information on the traditional syllabus is important, it isn’t always easy for students to quickly find what they need. Frustrated students may then resort to emailing the professor, only to be met with the ever-popular retort: “ IT’S IN THE SYLLABUS!”.
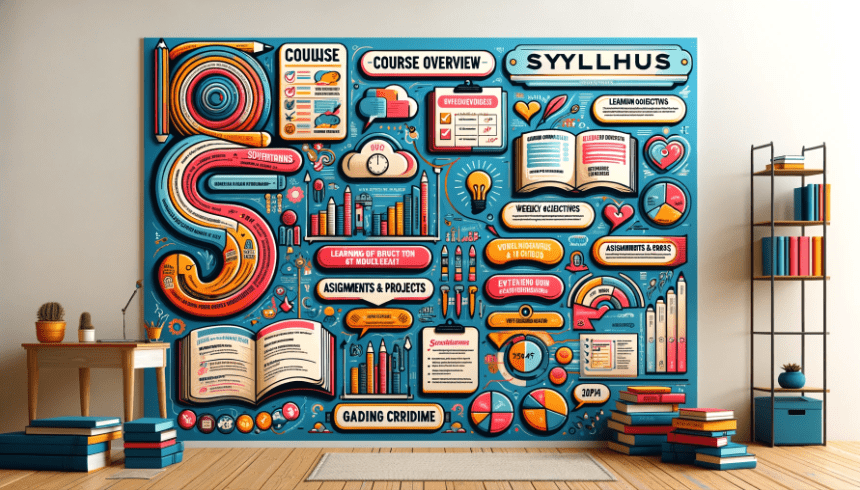
The most frequent questions from student questions are: When and where are my professors’/TAs’ office hours? When are the exams? How is my grade calculated? What happens if I miss an exam or problem set? Are there any opportunities for extra credit? So, I thought about ways to present this important information in a format that is both visually appealing and allows for quick comprehension. Voilà: meet the visual organic chemistry syllabus.
For the creation of the syllabus, I used PowerPoint, which is equipped with lots of free tools, including many icons to visually symbolize certain topics or activities. For example, I used a weight-lifting icon to indicate the importance of doing practice problems. In total, it took me a couple of hours to create my first visual syllabus. It was a quite enjoyable process and a rare chance for me to have fun with art and creativity.
I hope that the visual syllabus can be a tool that helps students access the information they need. The traditional syllabus can be intimidating, and a student in a time-crunch might not have the time or energy to go hunting for information in a 10-page document. And as a cherry on top the visual syllabus can save overworked professors from an onslaught of avoidable emails.
Remarkably, 90% of the students liked the idea of having a visual syllabus (Figure 1), and 43% even loved it . Likewise, 78% of the students stated that the visual syllabus helped them locate/access important information more quickly than the traditional syllabus (Figure 2). Only 2% of students did not like the visual syllabus.
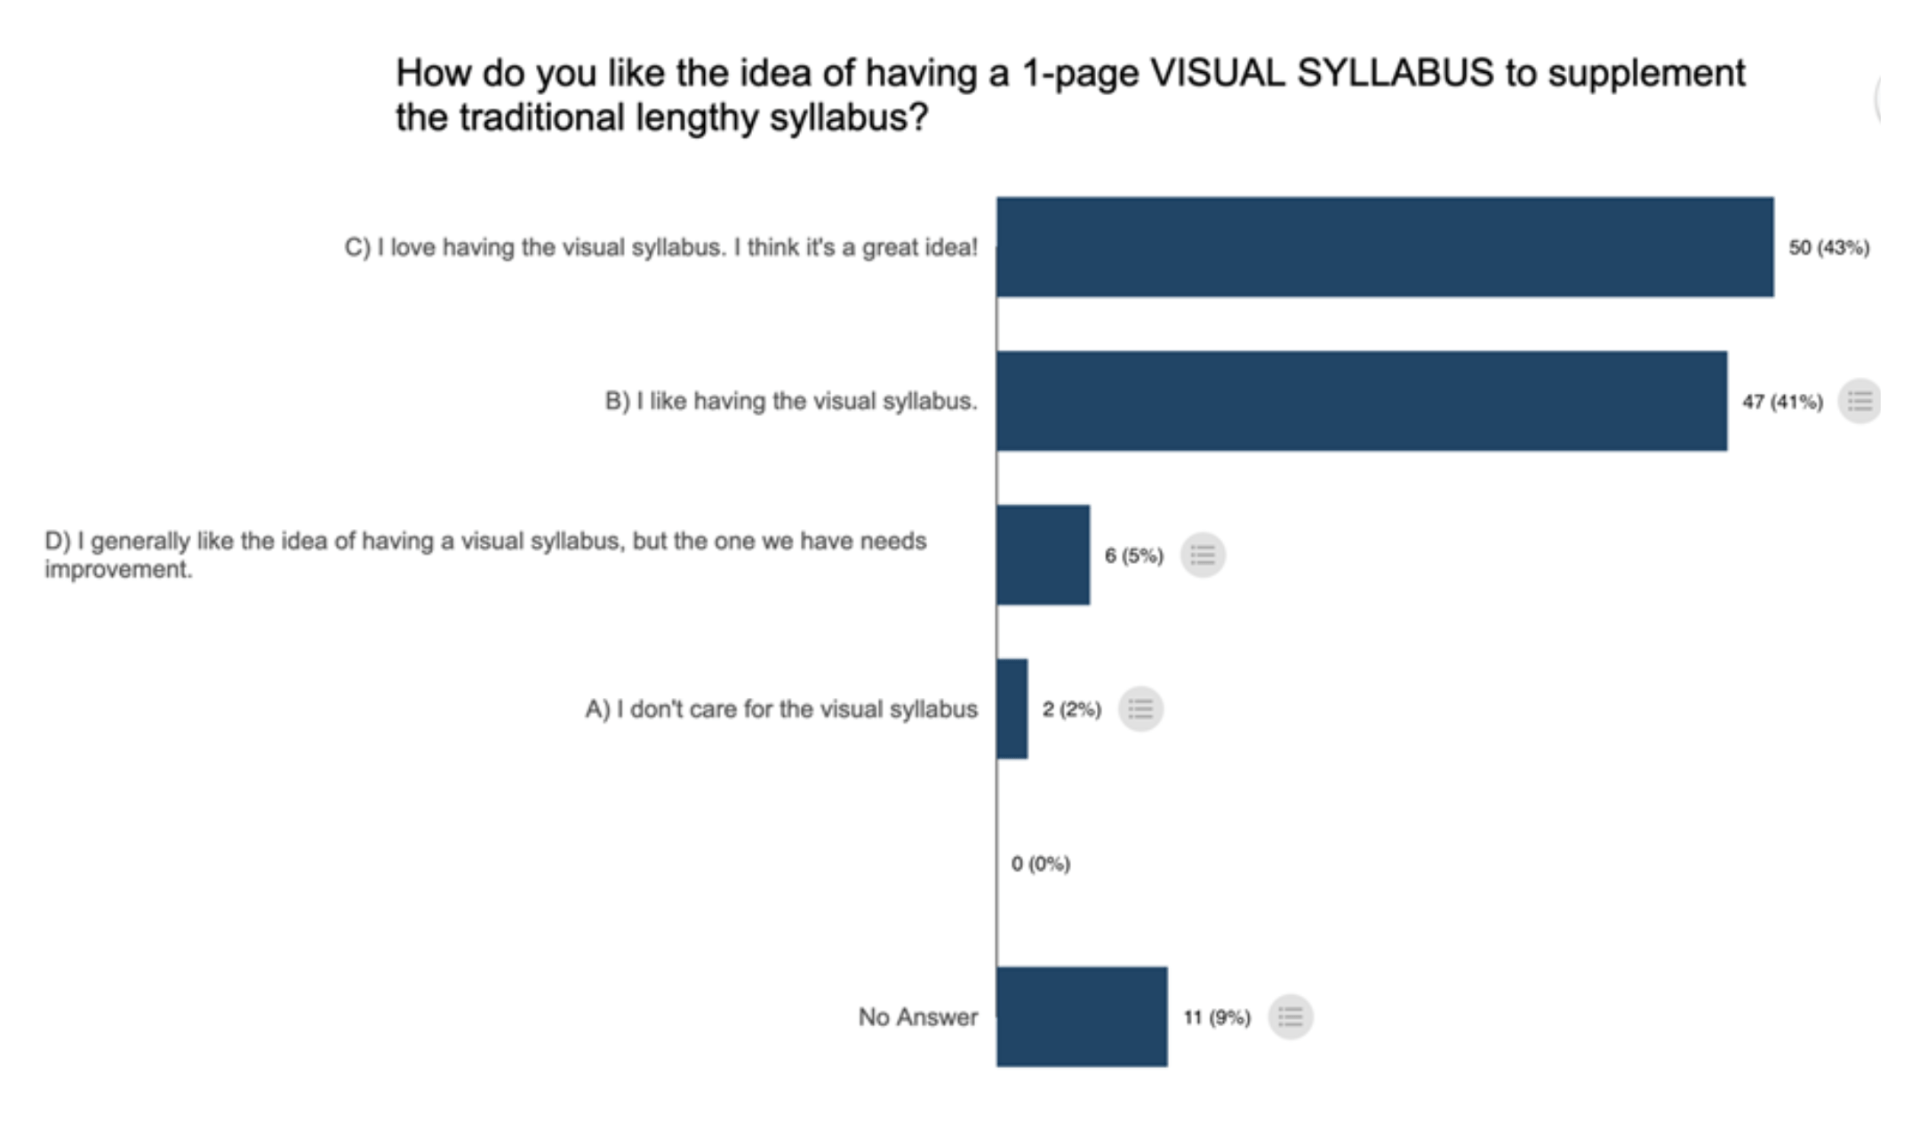
Figure 1. Student reactions to the visual syllabus (n = 105). (Poll data generated using the AktivChem app.)
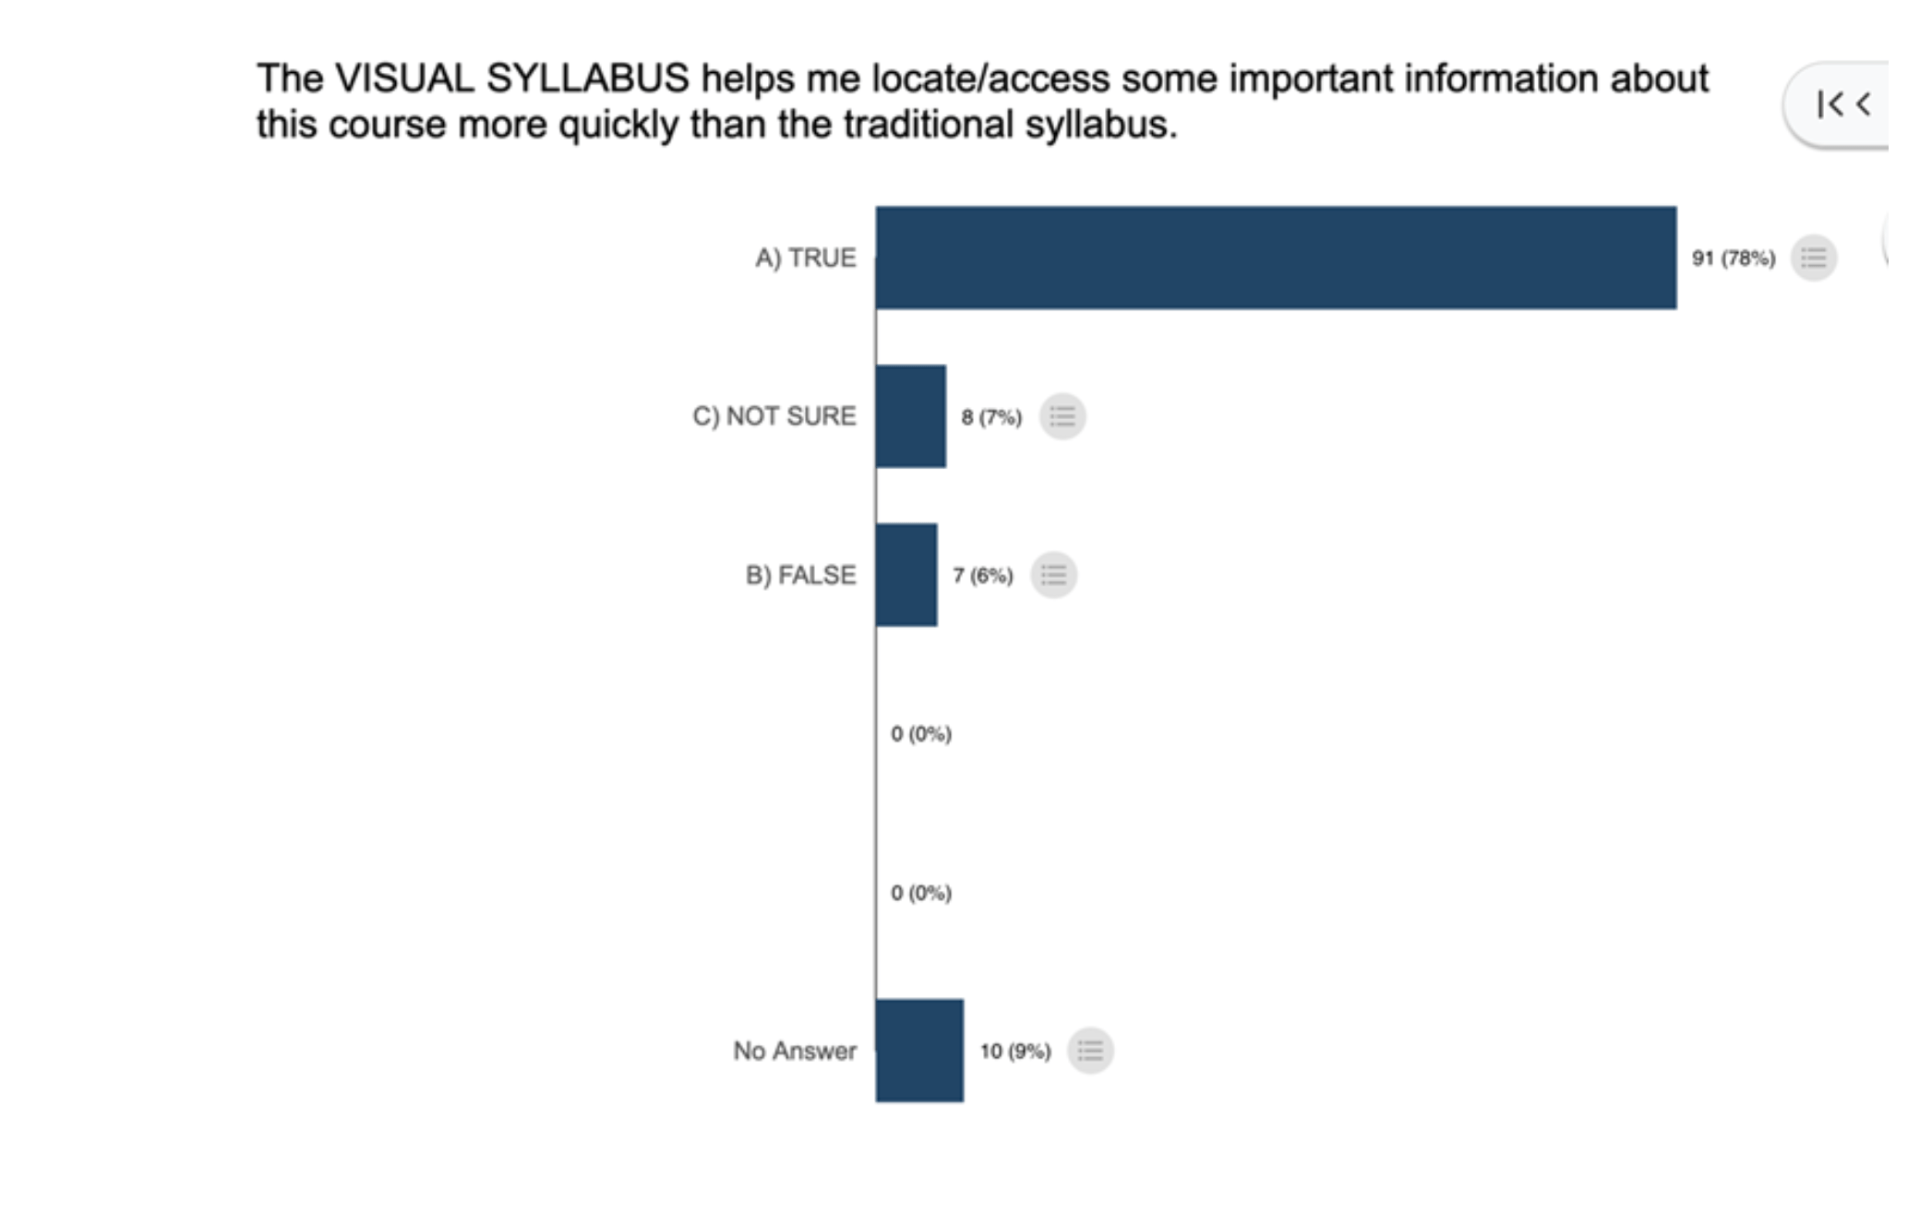
Figure 2. Student response to whether the visual syllabus facilitates finding of important information compared to the traditional syllabus (n = 106). (Poll data generated using the AktivChem app.)
© 2023 Dana Lashley. The text of this work is licensed under a Creative Commons BY-NC-ND 4.0 International License.
Meet the Author
Dana Lashley
Associate Teaching Professor of Chemistry, Arts & Sciences
Dana Lashley is an Associate Teaching Professor of Chemistry specializing in Organic/Medicinal Chemistry
